To generate a wave-like curve, we can simply evaluate the sine function,
y = sin(x)
at a series of values. For example, letting
x = 0.0, 0.1, 0.2, ....,
we generate successively
y = sin(0.0), sin(0.1), sin(0.2), ....,
Your generator should package these points in a polyline with z = 0
for all points. Thus, the polyline will consist of the series of points:
(0.0, sin(0.0), 0.0), (0.1, sin(0.1), 0.0), (0.2, sin(0.2), 0.0), ...
To generate a wider family of curves, you should include parameters in
your function to set:
y = a sin(f * x)
for values
x = 0.0, 0.0 + deltaX, 0.0 + 2*deltaX, ...
such that
x <= maxX
For the templated Polyline class, the prototype of your
sine generator should be:
Polyline<Point3D> GenPolylineSin(double delta, double extent, double period, double amplitude)
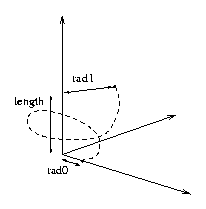
To generate a spiral curve, you should gradually move a point along an axis and increase it's distance from the axis, as you rotate it about the axis. Let's say we choose to rotate about the Z axis. Given an initial radius, rad0, a final radius, rad1, a length, length, and a number of revolutions, revs, we want to create a point distance rad0 from the origin and (one step at a time) rotate it about the Z axis while simultaneously shifting it parallel to the Z axis and increasing its distance from the Z axis (Whew!).
Start the process with a point p0, on the X axis distance length from the origin
     p0 = (length, 0.0, 0.0).
     insert (p0) in the polyline P;
     angle = 0;
     height = 0;
Add p0 to your polyline.
Write a loop that iteratively computes a point pi such that on each iteration
    Loop ( ..... to be completed ...... ) {

         // Compute a point with increasing distance from the Z axis

         pi = (length + a little bit, 0.0, 0.0)

         // rotate the point about the Z axis

         angle = angle + a little bit;
         pi.rotateZ(angle);

         // Set the Z value of pi

         height = height + a little bit;
         set Z component of pi to height;

         add pi to the polyline P;
        }
The function header should be:
Polyline<Point3D> GenPolylineSpiral(int n, double rad0, double rad1, double length, double revs)where the first parameter, n, indicates the number of points to be inserted into the polyline and the other parameters are as described above.
The Koch curve is a procedurally defined curve that was discovered by the Swedish mathematician Helge von Koch in 1904. The curve attracted the attention of mathematicians because it produces an infinitely long line in a finite area. The Koch curve is an example of a self-similar curve. Each part of the curve has the same form as the whole curve. Successive generations of a Koch curve are produced as shown below. The first generation is a straight line. The second generation is produced by inserting a "bump" on the line. The bump is created by dividing the original line into three equal length segments. If the original line has length l, then the three new segments have length l/3. The middle segment is replaced by two new segments of that also have length l/3 and are rotated to join at one end. The length of the new polyline segment is 4/3 l.
The third generation curve is made by placing bumps on each of the four line segments in the second generation curve. The length of each line segment is increased by 4/3. Therefore, the length of the entire curve is increased by 4/3. In general, each succeeding generation curve is 4/3 longer than the generation preceding it. As the number of generations approaches infinity, the curve becomes infinitely long, but it exists in a finite region.
To produce a Koch snowflake, we start with polyline containing three points at the vertices of an equilateral triangle. The first point is repeated at the end to close the figure. We then introduce three new points, pa, pb, and pc, between each pair of points in the polyline. If the original points are labeled p0, and p1, then the three new points are produced as follows:
       pa =  p0 + 1/3 (p1 - p0)
       pb =  pa + rotate( 60, 1/3 (p1 - p0))
       pc =  p1 - 1/3 (p1 - p0)
You should implement the equations above using the Point3D class to represent points. You should define your original three points to lie is the X,Y plane (i.e. set Z=0 for all three points.) You can then use the rotateZ operator for the Point3D class to perform the 60 degree rotation required to calculate pb. Each time you perform this process over your polyline, you will generate another generation of the Kock Snowflake. You should write a C++ function:
Polyline<Point3D> GenPolylineKoch(double length, int generationN)to generate a Koch snowflake of generation generationN where length is the length of the sides of the original triangle. An example of 5th generation snowflakes are provided in the class programs directory. See the files ThreeFlakes.wrl and SpiralSnow.wrl. To view these files, execute the command vrmlview command. For example, try
%vrmlview SpiralSnow.wrl
The program used to generate the data in SpiralSnow.wrl is given in
the file SpiralSnow.cxx